
Rental Arrears Index 2026: The state of social housing rent arrears
The rising cost of living has left many households facing increasing financial strain, with rent arrears for social housing tenants rising significantly.
Social housing rents have steadily crept up in recent years, yet the Government is still committed to continual annual increases, sparking calls to freeze rent increases.
Through Freedom of Information requests, Access PaySuite’s 2026 Rental Arrears Index reveals the true scale of outstanding rent owed to local authorities. We gathered data on the number of social housing units owned, the proportion in arrears, and the total value of those arrears.
As of March 2025, 228 local authorities owned social housing. Our analysis draws on responses from 108 authorities, representing nearly half of all providers.

Key findings
- Average value of arrears by local authority is up by 13% from 2025, and 57% from 2019.
- In 2026, 43% of social housing units are in rental arrears.
- The average arrears debt per social household stands at £675, up 29% from 2019.
- Local authorities are each owed an average of £2.96 million in unpaid rent.
- Total arrears across the UK could be as high as £675 million.
How many social housing units are in rental arrears in 2026?
In 2026, the scale of social housing rental arrears increased substantially. Now, more than 43% of social housing units are in arrears across every local authority that owns social housing. This is a concerning figure for housing designed to be affordable. Over the past year, the proportion has risen from 37% and is up from 34% in 2019.
Each local authority owns an average of 10,308 social homes. Despite demand driven by the cost of living crisis, housing stock has fallen 2% since 2019, our data finds, though government plans are in motion to build more than 70,000 new social and affordable homes in England.
Between 2025 and 2026, the average number of homes in arrears per local authority has increased 15% from 3,825 to 4,389, the largest single-year increase over the past seven years. Since 2019, that number has climbed 21% from 3,614.
Table to show yearly increase in the value of arrears per local authority
|
Year |
% of properties in arrears per authority on average |
Average value of overall rental arrears per local authority |
% change of average value of arrears per local authority |
|
2019 |
34.43 |
£1,884,165 |
|
|
2020 |
34.77 |
£2,055,189 |
9.08 |
|
2021 |
33.40 |
£2,303,801 |
12.10 |
|
2022 |
34.33 |
£2,403,057 |
4.31 |
|
2023 |
37.02 |
£2,676,061 |
11.36 |
|
2024 |
36.68 |
£2,720,444 |
1.66 |
|
2025 |
37.14 |
£2,631,154 |
-3.28 |
|
2026 |
42.57 |
£2,960,611 |
12.52 |
Are rental arrears becoming more widespread?
Our data highlights that not only is rent debt spreading to a wider proportion of households, but it’s also deepening.
In 2026, the average indebted household owed £675. While this represents a slight dip from £688, it’s a sharp 29% increase from 2019, when the average household owed £521.35.
Over the past several years, arrears have become more widespread and, on average, the debt owed has increased, indicating that a growing number of people are shouldering debt and financial strain.
How do rental arrears compare regionally?
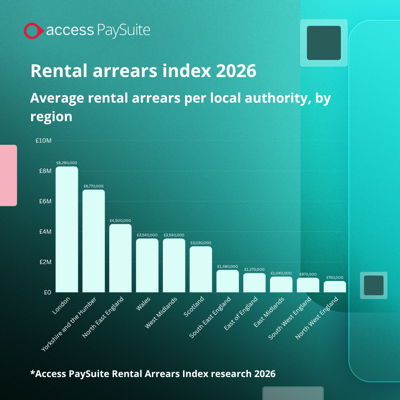
Rental arrears vary significantly across the UK, with councils in the hardest-hit region owed more than eleven times as much as those in the lowest.
These regional differences could be for a number of reasons, including population size, local deprivation levels and debt collection approaches.
How does the value of social housing arrears compare regionally?
London councils have the highest levels of rental arrears across the UK, with each local authority owing an average of £8.3 million, nearly triple the national average and eleven times that of the North West, which recorded the lowest average at just under £750k.
It’s also seen one of the biggest increases since 2019, jumping 89% from £4.4 million. Yet, over the past year, the capital has witnessed the smallest increase in arrears, indicating councils may be taking earlier action before tenants spiral further into rent debt.
Yorkshire and the Humber, North East England, Wales and the West Midlands all fall into the top five, recording the highest levels of arrears in 2026.
On the other hand, councils in North West England are owed the least in rental arrears, averaging £750,000 – nearly four times below the national average. Moreover, it’s the only region where arrears have fallen since 2019, dropping by 49% from £1.5 million. However, over the past year, arrears have risen 11%, serving as an early warning to local authorities that tenants could be struggling.
To slow this trajectory, an online payment system for local government can help identify vulnerable accounts that have missed payments while offering tenants flexibility when repaying.
Table to show the value of arrears per local authority in 2026
|
Region |
Total average value of rental arrears per local authority in 2026 |
Total average value of rental arrears per local authority in 2025 |
YoY % change |
|
London |
£8,287,947.88 |
£8,050,949.87 |
2.94 |
|
Yorkshire and the Humber |
£6,767,320.45 |
£5,653,172.96 |
19.71 |
|
North East England |
£4,495,865.43 |
£4,125,739.06 |
8.97 |
|
Wales |
£3,542,659.62 |
£2,816,486.18 |
25.78 |
|
West Midlands |
£3,538,927.27 |
£2,633,986.00 |
34.36 |
|
Scotland |
£3,031,830.91 |
£2,722,992.74 |
11.34 |
|
South East England |
£1,483,444.19 |
£1,397,629.58 |
6.14 |
|
East of England |
£1,265,482.24 |
£928,739.75 |
36.26 |
|
East Midlands |
£1,036,774.95 |
£770,547.90 |
34.55 |
|
South West England |
£974,358.27 |
£809,379.93 |
20.38 |
|
North West England |
£749,887.12 |
£672,668.53 |
11.48 |
Where are rental arrears increasing the most?
Our data also highlights fast-growing regional hotspots, where social housing rent debt is rising
Over the past year, the East of England saw the UK’s sharpest annual increase in average arrears value per local authority, jumping 36% from £929,000 in 2025 to £1.3 million in 2026. This steep climb follows a persistent upward trend, with councils' arrears across the region now up 62% since 2019.
Looking longer term, Wales has experienced the biggest increase in average arrears value per local authority, skyrocketing 134% since 2019, more than doubling from £1.5 million to £3.5 million. With arrears climbing a further 26% over the past year alone, arrears show no sign of slowing down, indicating that existing support frameworks and current collection strategies are struggling to keep pace with the amount of growing debt.
To curb this growth, councils could introduce government payment solutions equipped with real-time analytics to provide earlier outreach and support pathways. This should include a range of payment options, whether that’s real-time Online Payments or Open Banking, via Direct Debit or over the phone, as well as in-person at Post Office, PayPoint or Payzone outlets.
Table to show yearly change of the value of arrears per local authority
|
Region |
Average value of rental arrears per local authority in 2026 |
Average value of rental arrears per local authority in 2019 |
YoY % change |
2019 - 2026 % change |
|
London |
£8,287,947.88 |
£4,390,795.97 |
2.94 |
88.76 |
|
Yorkshire and the Humber |
£6,767,320.45 |
£5,359,293.16 |
19.71 |
26.27 |
|
North East England |
£4,495,865.43 |
£2,425,127.22 |
8.97 |
85.39 |
|
Scotland |
£3,031,830.91 |
£1,906,872.68 |
11.34 |
58.99 |
|
West Midlands |
£3,538,927.27 |
£2,971,784.11 |
34.36 |
19.08 |
|
North West England |
£749,887.12 |
£1,462,679.42 |
11.48 |
-48.73 |
|
Wales |
£3,542,659.62 |
£1,511,567.35 |
25.78 |
134.37 |
|
South West England |
£974,358.27 |
£462,256.28 |
20.38 |
110.78 |
|
South East England |
£1,483,444.19 |
£1,019,144.63 |
6.14 |
45.56 |
|
East of England |
£1,265,482.24 |
£780,409.38 |
36.26 |
62.16 |
|
East Midlands |
£1,036,774.95 |
£745,598.83 |
34.55 |
39.05 |
Commenting on the findings, Jamie Symons, head of product, from Access PaySuite, said:
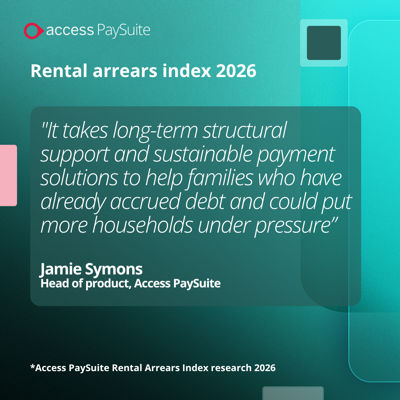
“Rising social housing rents and cost of living have left four in ten households struggling to keep up with rent payments. It takes long-term structural support and sustainable payment solutions to help families who have already accrued debt and could put more households under pressure."
“Local authorities have also faced long-term budget cuts and wider economic uncertainty, with arrears putting more strain on them. For social housing providers, the challenge remains finding a sustainable balance between supporting vulnerable renters and maintaining the income needed to deliver essential services."
“Our findings show rent debt is becoming more widespread and becoming deeper, indicating early intervention tools are needed to identify vulnerable households before they fall into a debt spiral. At Access PaySuite, we work with local councils to simplify rent collection, giving tenants more flexibility and choice in how they pay. Giving tenants options is a sure way of boosting collection rates, cutting costs and freeing up resources to support those most in need.”
What can social housing providers do to reduce rental arrears?
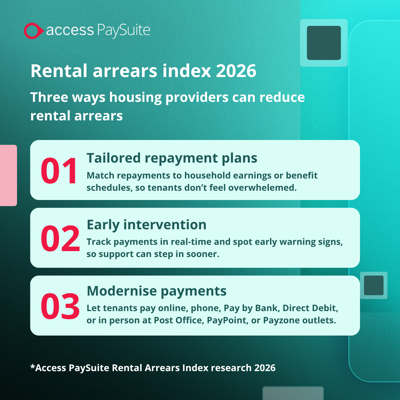
Tailored repayment plans – With the government committed to continued steady annual increases, many households will need a long-term repayment plan for debt already accrued. Providers should implement tailored repayment plans suited to their affordability. Doing this ensures payments align with household earnings or benefit schedules, preventing tenants from feeling overwhelmed.
Early intervention – Long-term arrears don’t happen overnight but usually start with one missed payment followed by a debt spiral. By using digitised public sector payment solutions, providers can track in real time and spot early warning signs, allowing support officers to intervene earlier and prevent unmanageable debt spirals.
Modernise payments - As rental arrears continue to rise, tenants need more convenience and flexibility from government payment solutions. A more modern approach lets tenants choose how they pay online, which makes rent payments easier.
Digitised public sector payment solutions have been shown to maximise collection rates and reduce costs thanks to more efficient processes within organisations; whether that’s real-time online payments or Open Banking, via Direct Debit or over the phone, as well as in-person at Post Office, PayPoint or Payzone outlets.
Next steps
Explore how Access PaySuite helps housing providers improve collections, reduce arrears and modernise payment experiences with scalable public sector payment solutions. Ask for a demo today to see how it works.
Rental Arrears Index methodology
Access PaySuite used the Freedom of Information Act to request details from local authorities about the number of social housing units, the number of units in rental arrears and the overall value of those arrears at the end of the financial year for the years 2019 - 2026. Requests were made and responses received in August and September 2026. In total, 108 local authorities provided the full set of data for analysis, representing nearly half of the total number of authorities that own social housing units.