Rental Arrears Index 2025: The state of public sector rental arrears
Social rents have fallen in real terms over the past decade, in theory reducing rent burden and making it easier for tenants to meet payment deadlines. Yet new data tells a different story: arrears are rising at a faster pace than the increase in households in arrears can cope with.
Through Freedom of Information requests, our 2025 Rental Arrears Index reveals the scale of outstanding rent owed to local authorities. As of February 2025, 229 local authorities owned 1.6 million social housing units. Our analysis draws on responses from 100 authorities - representing almost half of all providers - covering 2,100 data points from the past six years.
The guide will cover
Key findings at a glance
- Average value of arrears by local authority are up by 5% from 2024, and 55% from 2019.
- 40% of social housing units are in rental arrears in 2025.
- The average arrears debt per social household stands at £669, up 35% from 2019.
- Local authorities are each owed an average of £2.86 million in unpaid rent.
- Total arrears across the UK could be as high as £655 million.
In 2025, local authorities are owed just under £2.86 million each in unpaid rent - up 5% from 2024 and 55% from 2019. Across all 229 councils which own social housing, arrears could total £655 million, which could rise by as much as £240 million if just 5% of the Government’s planned £4.8 billion welfare cuts result in unpaid rent.

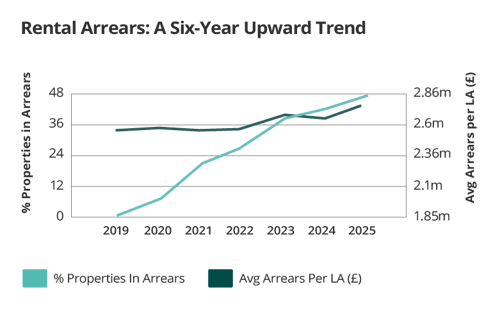
How many social housing units are in rental arrears in 2025?
|
Year |
% of properties in arrears per authority on average |
Average value of overall rental arrears per local authority |
|
2019 |
34.7 |
£1,850,662 |
|
2020 |
34.8 |
£1,997,591 |
|
2021 |
33.8 |
£2,295,847 |
|
2022 |
34.7 |
£2,397,371 |
|
2023 |
38.5 |
£2,654,051 |
|
2024 |
38.1 |
£2,723,681 |
|
2025 |
40 |
£2,859,786 |
In 2025, around 40% of social housing units are in rental arrears per authority - a concerningly high figure for intended affordable housing, with this proportion up by 2% over the past year and 5% since 2019.
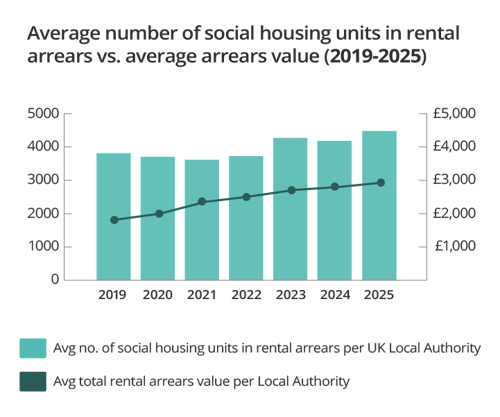
Each local authority owns an average of 10,692 social homes. From 2024 to 2025, the number of homes in arrears per authority rose 5.2%, from 4,063 to 4,274. Over the past six years, that number has climbed 14.1%, up from 3,745 in 2019.
Rising debt from more tenants
The data highlights a concerning trend where arrears are rising among more tenants.
In 2025, households owed an average of £669 in rent arrears, nearly unchanged from £670 in 2024 but up sharply from £494 in 2019.
While the proportion of homes in arrears has risen by 5% since 2019, the average household debt has increased by 35%, showing that arrears are deepening as well as spreading.
Over the past year, arrears have become more widespread without easing of debt levels: 2% more homes are behind on rent than in 2024 and the average amount owed has barely fallen, suggesting a growing share of tenants are carrying persistent financial burdens.
Despite social rents falling in real terms, affordability remains tight. In 2023/24, tenants in standard social housing spent 31% of their income on rent and service charge on average, and those in housing with on-site support spent 52%.

How does the value of social housing arrears compare regionally in 2025?
London was found to have the highest level of rental arrears across all UK regions, with local authorities in the capital owed £6.8 million on average - around ten times more than the East Midlands, which had the lowest average arrears per authority at just under £700k.
Yorkshire and the Humber, North East England, Scotland and the West Midlands all fall into the top five, recording the highest levels of arrears in 2025. However, the West Midlands is the only region to see a decline in arrears over the past year, down 6% from 2024.
Wales has seen the steepest growth in arrears, up 13% from £1.96 million in 2024, and 94% from £1.14 million in 2019.
|
Region |
Total average value of rental arrears per local authority in 2025 |
|
London |
£6,808,781.26 |
|
Yorkshire and the Humber |
£5,794,908.58 |
|
North East England |
£4,389,929.30 |
|
Scotland |
£3,854,221.32 |
|
West Midlands |
£3,048,396.69 |
|
North West England |
£2,398,597.13 |
|
Wales |
£2,216,369.36 |
|
South West England |
£1,689,924 |
|
South East England |
£1,378,824.94 |
|
East of England |
£1,169,342.52 |
|
East Midlands |
£681,431.38 |
How does this compare to housing associations?
Around 2.9 million social housing units are owned by housing associations. In March this year, the Regulator of Social Housing reported around 33.5% of tenants being in rental arrears in these properties.
While the proportion of tenants in arrears has fallen slightly since 2024, the average debt per tenant has risen 7.3 percent, showing a similar trend to local authority arrears whereby a higher debt is owed from fewer households.
Universal Credit tenants continue to be in higher levels of arrears compared to tenants paying by other means, but data since June 2024 suggests the difference is getting smaller.
Commenting on the findings, Alex Common, product and engineering director of Access PaySuite, said:
“While falling rents for social housing in real terms might suggest reduced pressure on tenants, the reality is that many households are still struggling to keep up with payments. Economic uncertainty, welfare changes and rising living costs mean rental arrears continue to place a significant strain on local authorities and the communities they serve.
“For councils and housing associations, the challenge remains finding a sustainable balance between supporting vulnerable renters and maintaining the income needed to deliver essential services. The data reveals a persistent and troubling rise in the level of tenant debt that continues to outpace growth in the proportion of households in arrears, which signals serious long-term risks.
“At Access PaySuite, we work with social housing providers to simplify rent collection, giving tenants more choice and flexibility in how they pay. Making rent payments easier is one of the fastest ways to boost collection rates, cut costs, and free up resources to support those most in need.”
What can social housing providers do to reduce rental arrears?
- Help tenants access unclaimed benefits
With welfare cuts expected to add £240 million to rental arrears, landlords are urged to prepare now by strengthening support for tenants and helping residents access unclaimed benefits - especially as these cuts are likely to hit the 59% of tenants living with a disability or long-term illness particularly hard.
- Invest in energy efficiency
The National Housing Federation says insulating and draft-proofing social housing could cut energy bills by 42% and save tenants £567 per year - a total saving of £700m across the UK. As bills rise, such savings could drastically increase social housing affordability, reducing households in arrears and the amount owed to landlords
- Modernise payments
As rental arrears continue to rise, tenants need more convenience and flexibility from government payment solutions. A more modern approach can empower tenants to choose their preferred online payment system for local government, making rent payments easier
Digitised public sector payment solutions have been shown to maximise collection rates and reduce costs thanks to more efficient processes within organisations; whether that’s real-time online payments or Open Banking, via Direct Debit or over the phone, as well as in-person at Post Office, PayPoint or Payzone outlets.
With the creation of a new National Housing Bank - a planned government-backed lender for affordable housing - and a £39 billion for affordable homes, the UK has a rare opportunity to deliver change that improves housing, wellbeing, and financial stability.
Rental Arrears Index methodology
Access PaySuite used the Freedom of Information Act to request details from local authorities about the number of social housing units, number of units in rental arrears and the overall value of those arrears at the end of the financial year for the years 2019 - 2025. Requests were made and responses received in June and July 2025. In total 100 local authorities provided the full set of data for analysis, representing almost half of the total number of authorities which own social housing units.